The Inequality Blog

Bill English is quoted in the Herald today as saying, a propos of rising house prices and low housebuilding numbers:

It’s clear that the lowest-income households have been the most affected so our planning processes have probably done more to increase income inequality in New Zealand than most other policies and it does remain a challenge to make progress.

But while it is true that housing does have an impact on inequality, I’m not sure there’s evidence to justify that claim.

Rising housing costs are affecting people on low incomes, certainly. The international standard is that no one should spend more than 30% of their income on housing costs, otherwise there just isn’t enough left for other things. But the percentage of New Zealanders spending more than that on housing has risen from 11% in the 1980s to 27% now. Most of these will be the poorest New Zealanders.

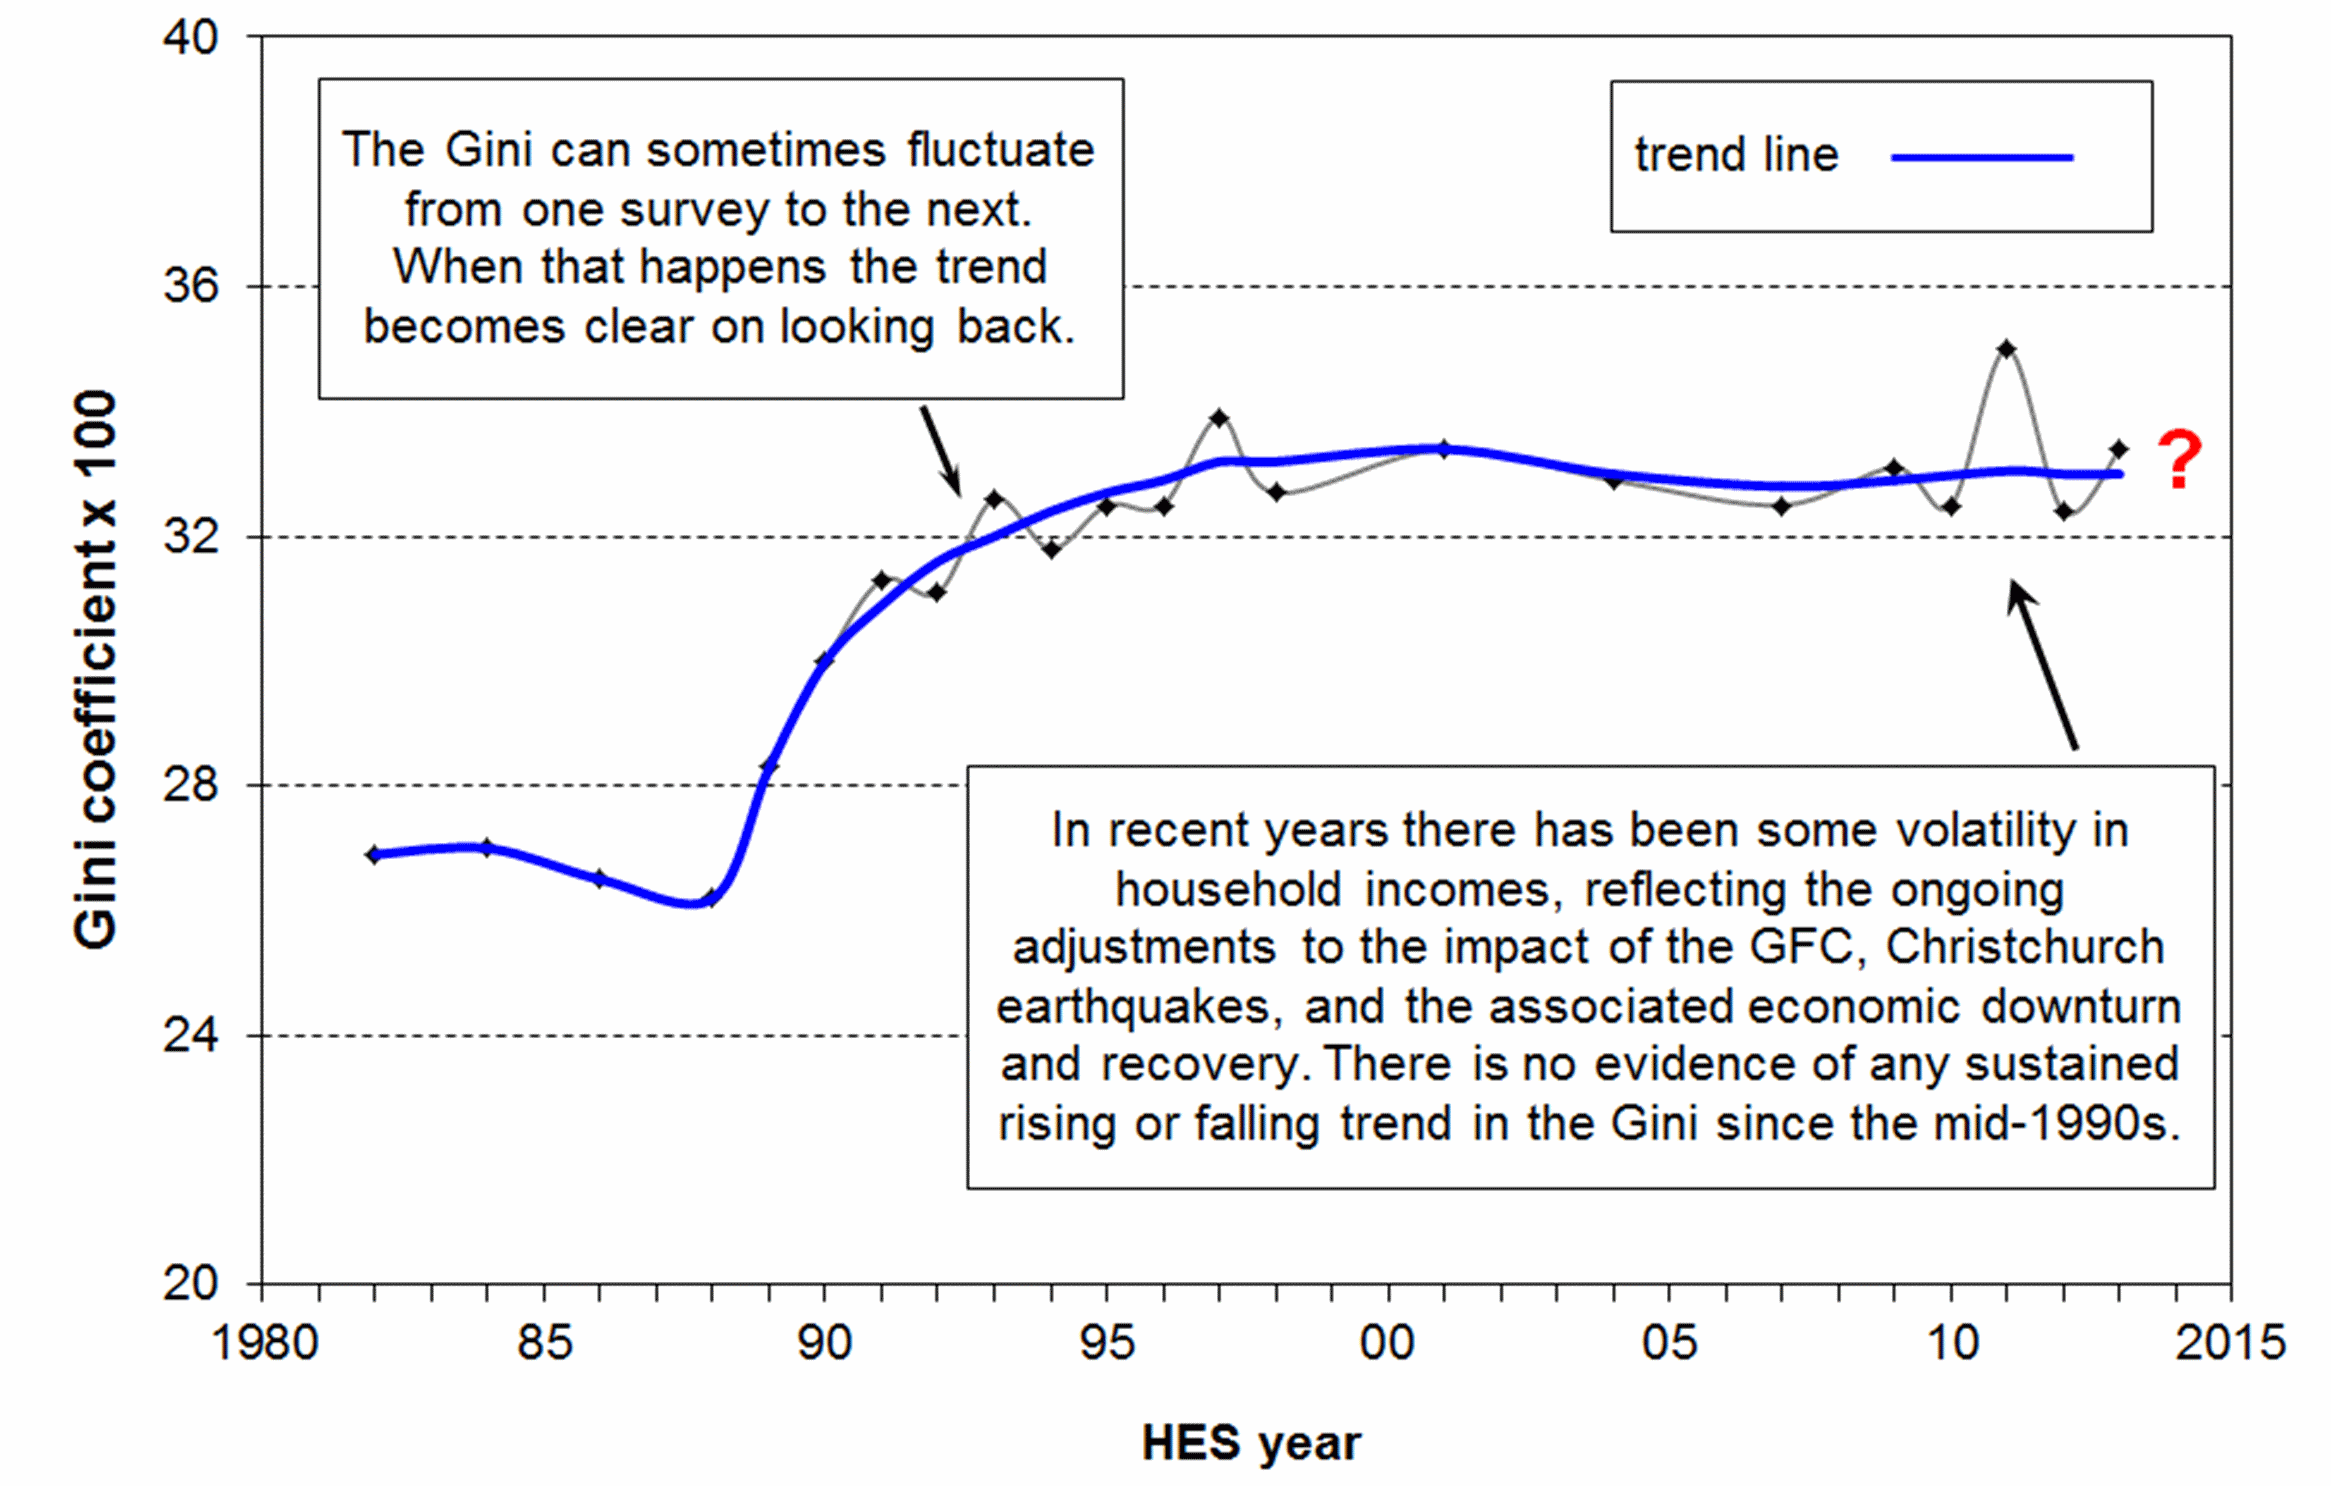
So when you look at the figures on inequality produced every year by the Ministry of Social Development, it’s clear that housing costs do make inequality worse. But – and this is the real problem for English’s argument – inequality is already very high, and has risen hugely since the 1980s, even before housing costs are taken into account. It’s not at all the case that, if you took housing out of the equation, everything would be hunky-dory. In fact, the gaps caused by other things swamp the gaps caused by housing.

So it seems unlikely that New Zealand’s planning processes have “probably done more” to increase inequality in any other. Far more important factors, in my opinion, would include reduced taxes on top earners, lower benefits, weaker union bargaining power and the influence of globalisation and technology.

And, even if you think housing is driving inequality, it’s not clear that planning processes and councils are to blame. Well over 90% of resource consents are processed without any notification or anything else to slow them down. And council development charges make up a fraction of housing costs. The bigger problems are likely to be the fact that we have almost no firms that build more than 100 houses a year, so hardly anyone can get economies of scale to drive down prices; and local opposition (as I see locally in, say, Johnsonville) to building more in urban centres.

Wealth inequality

As a final note, English’s argument ironically points to facts that his opponents, notably Labour’s David Parker, want to stress.

One of the big things that has probably happened in the last decade is a major increase in wealth inequality, in terms of the assets that people own.

Fewer and fewer people own their own home; those that do have seen the value of those homes increase sharply. Since half of all our assets are held in the form of housing, this (along with other things) means that wealth inequality has almost certainly been increasing (although we haven’t been measuring, so it’s hard to be sure).

Anyway, this is the point that Parker makes every time English claims that inequality isn’t getting worse. Inequality of income may have been relatively flat in the last few years, but inequality of wealth probably hasn’t.

In other words, talking about housing as a contributor to inequality may not help English as much as he thinks it does.

New Zealand is likely to face increased concentrations of wealth, inequality and power in the twenty-first century, according to newly assembled data.

Economist Geoff Bertram, in a lecture to the Institute for Governance and Policy Studies, where he is a senior associate, said data he had assembled showed New Zealand fitted the pattern of other countries set out in Thomas Piketty’s groundbreaking work Capital in the Twenty-First Century.

Noting that concentrated wealth and power among elites was the norm for non-capitalist societies, Bertram said Piketty’s work asked the question, ‘Are capitalist societies different?’. Piketty’s answer was an “essentially pessimistic” one, predicting the emergence and entrenchment of a wealthy capitalist elite across the major developed countries, though he did not present data for New Zealand.

Some wealth holders might originally have been entrepreneurs, but as their wealth accumulated, they rapidly became “rentiers”, earning profits simply by virtue of owning assets.

Piketty also showed that the level of wealth in a society, measured as a multiple of the income generated by that society in a given year, was determined by the economy’s savings rate divided by its growth rate.

This implied that the share of national income going to the wealthy was not determined by its “productive contribution” but was essentially fixed as a result of other variables.

Neo-classical economists had justified returns on assets by arguing that wealth contributed to productivity and economic growth, but Piketty’s data showed that wealth levels fluctuated hugely during the 20th century without any apparent connection to growth rates. “The entire body of neo-classical growth theory has simply been parked out of the way,” Bertram said.

Piketty’s key insight was that standard savings and growth rates would tend to drive the level of wealth towards an equilibrium with a “very high” level of inequality. If the savings rate could be assumed to be 12% a year, and growth 2%, the level of wealth would stabilise at six times a country’s annual income – a figure similar to that seen in nineteenth-century Europe.

One key driver of this widening inequality was the fact that the rate of return on wealth was – with the exception of the mid-twentieth century – generally much higher than the growth of wages and salaries.

Neo-classical economists had argued that this effect would taper off, because as more wealth was amassed, the abundance of it would drive down its returns. However, this was not true if, as Piketty argued, accumulated wealth could displace labour “out of productive employment”, taking “a larger and larger piece of the action”.

And because so much wealth was held by “a subset of the population”, this would in turn drive widening income inequalities.

In New Zealand, income inequality had been relatively stable in the last decade, but this masked growing wealth inequality of the kind Piketty had identified, Bertram said.

A very large rise in income inequality from the mid-1980s to the early 2000s had translated into a concentration of wealth at the top, and Statistics New Zealand research showed poor households borrowing large amounts while wealthier households saved, exacerbating existing inequalities.

Data assembled by Bertram showed New Zealand’s stock of wealth following a similar pattern to the countries in Piketty’s work. In particular, it had risen sharply in the 2000s, as households had taken “a decade or so” after the sudden rise in income inequality to watch their balance sheets either improve or decline.

New Zealand’s wealth concentration was converging to the same level as those of the major world economies covered by Piketty, Bertram said. This was not surprising given that New Zealand’s economy was “as open as you can get” to foreign wealth, individuals and ideas. Also, the factors determining wealth inequality – such as the savings and growth rates – tended to become equalised in a globalised world.

This implied that local policymakers who had contributed to New Zealand’s increased inequality – including politicians such as Roger Douglas and Ruth Richardson – were merely “riding the wave” of growing world inequality. “[Local] institutions and policies matter, but they are countervailing forces, not the prime drivers.”

Permalink

Donal Curtin has an interesting post up (responding to a talk I gave), in which he looks at whether large income gaps lead to lower social mobility.

He presents a version of the graph below (where unequal countries have high ‘generational earnings elasticity’, i.e. a strong link between parents’ income and the income of their kids), and says:

What you get is an overall pattern where the more unequal countries tend to be the less intergenerationally mobile. 

Corak Great Gatsby graph

So much is uncontroversial. He then adds:

There are those who would make a strong argument from this graph – that it’s the inequality that is causing the lack of mobility, and in turn that would tend to take you down a policy route emphasising redistributive policy.

I don’t think that’s necessarily true: I’m rather inclined to view both these outcomes (inequality and immobility) as caused by a third factor again, namely the social and economic openness of a society. In the UK you’ve got the class system; in much of continental Europe you’ve got insider/outsider labour markets. I’d still be tempted to bang away at those sorts of barriers to equality of opportunity: as far as I’m concerned, you can jack up the progressivity of the income tax system all you like, but it’s not going to make a blind bit of difference to the career prospects of the young Arab girl in a French slum.

This is an interesting point, and I’d be very curious to see some kind of analysis that compares a measure of “openness” (whatever that would be) with income inequality to see which of them has a stronger influence on social mobility.

Just looking at the countries, however, I’m not sure that openness explains things. If you concentrate on the developed countries (as this version of the graph does), one of the countries with the worst social mobility is the United States, which is famously open (or used to be) to immigrants and foreign capital. At the other end, the countries with the best social mobility are predominantly the Scandinavian ones, and they are probably a mixed bag, being economically open (little protectionism, as I understand it) but not socially very good at, say, integrating immigrant populations.

For me, inequality still seems like the most likely cause, not least because the guy who put together the above graph, Miles Corak, has a convincing argument about how this works:

Socio-economic status influences a child’s health and aptitudes in the early years—indeed even in utero—which in turn influences early cognitive and social development, and readiness to learn. These outcomes and the family circumstances of children, as well as the quality of neighbourhoods and schools, influence success in primary school, which feeds into success in high school and college. Family resources and connections affect access to good schools and jobs, and the degree of inequality in labour markets determines both the resources parents have and ultimately the return to the education children receive. This entire process then shapes earnings in adulthood.

To return to Curtin’s final point, would reducing income gaps make any difference to the career prospects of a young Arab girl in a French slum? Perhaps not in that case, and I certainly accept the point that barriers to opportunity, as a separate matter to inequality, should be tackled. But in the wider picture, I would still say, yes, a more equal society will generally be one in which the group of people he describes will have higher incomes, better social support and generally stronger life chances.

Permalink

In light of today’s news that ACT leader Jamie Whyte believes most children are poor because their parents are addicts, I thought it was worth briefly posting some comments made last week by ACT’s Auckland Central candidate Dasha Kovalenko.

Speaking at a forum on poverty that I chaired, Kovalenko, a 25-year-old junior lawyer, said there was a universally accepted “recipe for success” for anyone wanting to stay out of poverty.

She told the forum, organised by the Waiheke Budgeting Services, that this recipe had four elements:
1. “Complete your schooling”
2. “Get a job”
3. “Avoid getting pregnant”
4. “Get married and stay married”

In response to howls of laughter from the predominantly left-wing audience, she insisted: “It’s true, it’s true.”

Permalink

Recently I was interviewed for an article by a Marlborough girls college media student, Michaela Brooke Baillie, on inequality in New Zealand.

One of the most disturbing parts of the article is the following section, in which she describes an evening meal at the local soup kitchen:

After everyone has eaten and returned their plates, a man approaches the serving area and asks if he may take every diner’s scraps home so he may have something to eat for the following days. It unnerves me to witness this occurring in my community, and shocks me to see that New Zealand is a country where poverty such as this occurs.

When people say there’s no real poverty in New Zealand, I wonder if they know about stories like this.

Economist Gareth Morgan recently argued that it’s inequality of opportunity, not any other inequality, that matters.

With respect to Morgan and his huge contribution to this debate (in The Big Kahuna and elsewhere), I don’t think that’s the case.

He argues:

Surely we want to make sure that the poor have enough to participate. That is the approach taken by the Nobel Prize-winning economist Amartya Sen. Granted, what is needed to participate in society will change over time as new technology becomes available, but it seems to make sense to focus on giving everyone the basics they need to get ahead. That is why here at the Morgan Foundation our view is that it’s inequality of opportunity that is the real issue, rather than inequality of income or wealth.

Of course, participation matters; in fact, it’s crucial. But this argument misses the point that one of the things people need to participate is more income. You can create all the opportunities you like, but children aren’t going to be able to – say – take advantage of great teaching if their parents don’t have the income to properly clothe them, they can’t concentrate because they’re so hungry, and their parents can’t afford to move to a bigger, warmer house where they have somewhere quiet to study and there isn’t mould making them sick.

Those are the problems these kids face – and fixing them takes money. So it’s the inequality of income that matters. That doesn’t mean total equality: it just means much more equality than we have now. Closing income gaps to the level in Scandinavian countries – roughly half ours – would do just fine.

Morgan also argues that the Spirit Level thesis – that big income gaps lead to bad social outcomes – doesn’t have much to offer. But, to take just one example, the Spirit Level authors show how a poor child’s sense of inferiority in unequal societies damages their confidence and lowers their school results. Again, it’s inequality of income that matters.

Think, too, about people working in low-wage jobs like rest home carers. They don’t need ‘opportunity’ to do another job – they want to keep doing what is an essential task. They just need – and deserve – to be paid better. That’s not about opportunity; it’s about inequality of income.

So income matters – and, anyway, you can’t separate it out from opportunity. The ultimate proof of this is in the work of Miles Corak, a Canadian labour economist, who has shown that much more equal countries have much better social mobility: what your parents did doesn’t determine your future. In unequal countries, it does.

To improve opportunities, he argues, you need to close income gaps. In short, it really is income that matters.

The greatest pay excesses, in New Zealand and elsewhere, are in the private sector. But pay rates for the chief executives of government departments have also spiralled over the last three decades.

And more so in New Zealand than almost anywhere else, it seems. The chart below, from the OECD’s Government at a Glance repPublic sector chief executive pay
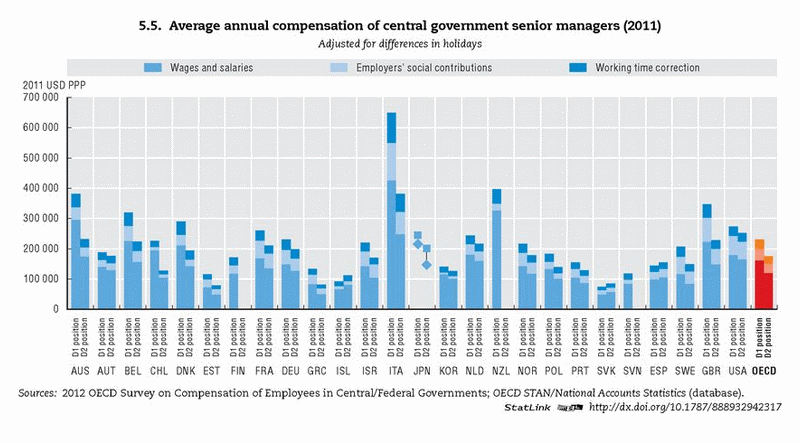
ort, shows the average chief executive in a New Zealand government department earned US$400,000 in 2011. Only in Italy, where average pay was a stratospheric US$650,000, did public sector chief executives do better. What’s more, if you compare the pay of chief executives with those of other people with university qualifications, as in the chart below, New Zealand’s government CEOs are the highest-paid in the world.

You might ask how on earth Italian public sector bosses can be paid so well, given the country’s apparently deserved reputation for inefficient and corrupt bureaucracy. (Actually, that might be the answer right here.) But for New Zealand,

Public sector chief executive pay 2
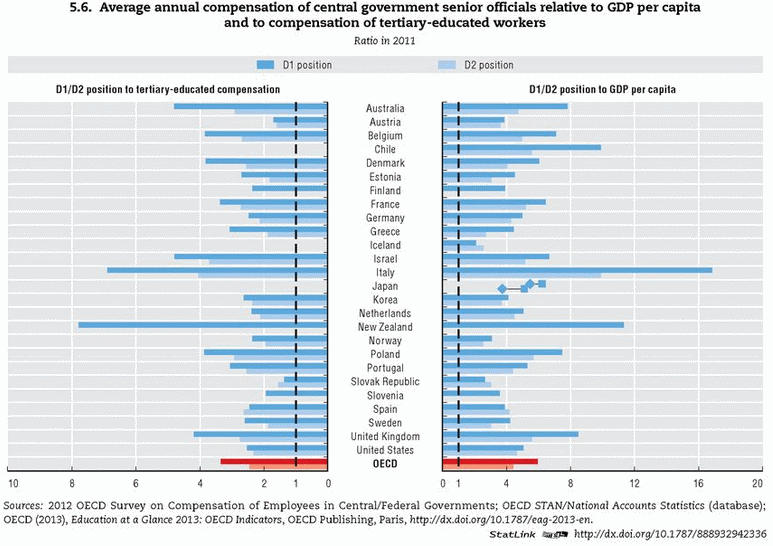
the question is how can we have such high pay rates, in a country that is small by international standards?

The answers will be complex, but it would be no surprise if a large part of the reason is our enthusiastic embrace of corporatisation in the 1980s and 1990s. More than any other public sector, I think, New Zealand’s government departments were restructured to be more like big companies.

With big companies, typically, come big salaries, and all the related justifications (albeit with little evidence to back them up) about the need to pay ‘what the market determines’, get the ‘best’ talent, and so on. (It’s interesting, of course, that this rationale tends not to apply to people further down the tree. Pay rates for ordinary public sector workers haven’t risen out of line with what their private sector counterparts get.)

It is tempting to conclude, then, that while the highest-paid chief executives are, as I said at the outset, in the private sector, the spiralling pay rates both there and in the public sector may have similar roots.

There’s a great piece today on one of the economist’s blogs, arguing that more redistribution is needed to make globalisation work.

It’s coming in response to a recent line of attack on anti-inequality arguments: the idea that, because poorer countries are catching up to richer ones, and therefore global inequality is declining, we shouldn’t worry about inequality within rich countries.

As the blog points out, this doesn’t stand up to scrutiny. There is every reason to be concerned about inequality within a rich country, including issues such as

shady financial practices, implicit or explicit subsidies to big banks, tax systems that enable the very rich to pay shockingly low effective rates, and the perception—not entirely inaccurate—that the very rich are using their resources to rig the political system in their favour

And, in fact, inequality within rich countries is important to fostering the kind of openness of global trade that people want to see.

Reducing barriers to trade generates net gains, but those gains will occasionally be distributed in highly unequal fashion. If gains are concentrated and no provision is made for redistribution, then a voting majority might well conclude that openness is a losing proposition…

A generation of global integration has been very good for the world’s developing economies. In light of that, the most important question, to me, is how best to maintain broad public support for openness and integration. I tend to think the best hope lies in governments which ensure that the gains from openness are broadly shared and which are responsive to the economic discomfort of typical workers.

This is the argument that one of the leading globalisation thinkers, Dani Rodrik, has been making for a long time. The more integrated the world economy, and the more exposed that workers in any one country are to sudden changes in the global economy, the larger the welfare state needed to support them through the adjustment to those effects.

(Of course, governments also need to be able to accept or reject parts of the globalisation agenda, and do what is in the interests of their own economies and societies, which may not always be to immediately increase openness to trade; but that’s another argument for another day.)

A reader has just emailed in with a link to something she’s been working on: this amazing graphic on poverty in America, and how it’s changed over the past 50 years.

One thing that stands out for me is how much more educated people are (especially going by high school graduation rates), yet poverty levels remain stubbornly high (albeit they could be worse). It’s just another reason to be suspicious of the argument that more education is the solution to our inequality problems.

Permalink
  • This year’s Household Incomes in New Zealand, a key report on poverty and inequality published yesterday, bears very little to cheer about. Key points below.
  • Inequality has risen slightly post the global financial crisis, reversing the decreases we saw before that thanks to policies like Working for Families. Since 2009, incomes have been static or falling for people in the poorest half of the country, but increasing for the rich, though without really taking off, as they have done in, say, America.
  • The Gini coefficient, a standard measure that adds up all the income gaps in a country and in which a high score indicates high inequality, is shown in the graph below. The gentle decline in the early 2000s, and the gentle rise post-2009, are both clear.
  • Gini coefficient NZ 1982-2013Also, don’t forget the real story about inequality, which is very clear from the graph: the huge surge we saw in the 1980s and 1990s, which was the biggest in the developed world, and which has left us far, far more unequal than we were 30 years ago.
  • On another measure, we can look at how much someone in the richest 10% earned compared to someone in the poorest 10%. The average rich person now earns 7.5 times as much as the average poor person, whereas they used (in the 1980s) to earn 4.5 times as much. That’s a big shift.
  • That story holds if we look at the figures just for the last few years. Since 2010, the average person in the richest 10% is nearly $10,000 better off. But the average person in the poorest 10%? They are just $200 better off.
  • Poverty rates remain high – double what they were in the 1980s. Around 18% of the total population (adults and children) were in poverty in both 2009 and 2013. (That’s using the measure that people are in poverty if they have less than 60% of the average income, accounting for household size and housing costs.) That means almost 800,000 people are poor, out of 4.4 million.
  • For children, the number in poverty (using the same measure) has fallen in the last year, from 285,000 to 260,000, for reasons that are so far unclear.
  • Regardless, these rates are still far, far higher than a generation ago. The percentage of all people in poverty was 9% in the mid-1980s; now it’s 18%. The percentage of children in poverty was 11% in the mid-1980s; now it’s 24%.