The Inequality Blog

The latest OECD report on income inequality is out, showing New Zealand as one of just six countries where inequality was stable or falling from 2007 to 2011.

This doesn’t alter what we already knew, which is that nothing much changed here between the global financial crisis and the end of the current data we have, which only runs to 2011-12. (As is true everywhere, data is only released with a certain lag.)

In that period, top incomes fell along with bottom ones, because the sharemarket took a dive and corporate profits were lower. That’s not an unusual post-crisis picture: top incomes are often the most volatile.

What we don’t know is what has happened since 2011-12 – and we’ll find out some more of that next month, when the Ministry of Social Development releases the latest issue of its gold standard inequality/poverty document, Household Incomes in New Zealand.

Given the anecdotal reports of a return to high levels of luxury spending, compared with tepid increases in employment and salaries, I would expect that next instalment to show inequality increasing again – but we’ll have to wait and see. Even then, we’ll only know part of the picture. We won’t know how capital gains are increasing for the rich, because we don’t tax or record them; and we won’t know what’s happening to the income hidden in trusts.

It’s also important not to forget the wider story here. Whatever has happened in the last few years, nothing changes the fact that New Zealand had the developed world’s biggest increase in inequality from the mid-80s to the mid-2000s. The gap between the rich and the poor pretty much doubled.

That’s the context we’re working in, and the issue we have to deal with.


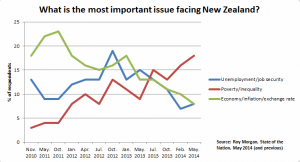
The combined issues of inequality and poverty have surged past traditional concerns about the state of the economy and unemployment to become the number one issue for New Zealanders, according to polling data from Roy Morgan that I’ve just crunched.

As you can see from the graph, it’s been a huge rise over the last years for concerns about imbalances in income and wealth.

Inequality on Roy Morgan

The explanation, I think, is that a few years ago, in the immediate aftermath of the global financial crisis, people knew that pretty much everybody was doing badly, and their main concern was for their own position. Hence the fears about the state of the economy, and unemployment.

Now that the economy is theoretically well into a recovery, with growth expected to be 2-3% in coming years, that has all changed. People see growth – but they feel they are not getting their fair share. Since nearly half the workforce didn’t get a pay rise last year, and benefits haven’t been increased (except for inflation) in a very long time, they are probably right to feel that way.

All of which means that questions of distribution – ‘who is getting what?’ not just, ‘am I doing okay?’ – become much more relevant. So unless dramatic steps are taken to redistribute income, we can expect to see these concerns continue to rise in the coming months and years.

On Wednesday the New Zealand Council for Christian Social Services (NZCCSS) hosted an event on inequality and the Budget with ministers Bill English and Paula Bennett.

Perhaps the most telling phrase came from English, when he said that, in his view, a lot of the debate around inequality was “true, but useless”.

This implied that, while it’s true that inequality has risen significantly in the last 30 year, there’s no point worrying about income gaps, just absolute poverty and “persistent deprivation”.

It was a shame the ministers couldn’t stick around for the NZCCSS presentations, which argued that the two things are inextricably linked: people’s incomes are so low because we have an economic system in which a lot of the rewards of their hard work are being channelled upwards into the arms of the richest 10%.

English didn’t see a connection, however, and focused instead on policies like free GP visits being extended from age 6 to age 13, which he argued would make a significant difference, and help reduce hospital admissions, for a cost of just $30 million a year. (The low pricetag, English admitted, might be in part because “kids between six and 13 don’t go to the doctor much”.)

The government was also asking itself what it should do with the expected welfare savings from more people moving into work, and whether they should be “recycled” back into more active support for those still on benefits.

In what looked like an admission that benefit levels and other supports are too low, English said: “At the bottom level, quite apart from the benefit levels, we under-resource them [families in poverty].”

Interestingly, he insisted that fiscal discipline and taking a tough line on beneficiaries was necessary to generate support for more welfare spending. The government had to show middle New Zealand that “putting more money in won’t make the problem worse”, and people would develop “a stronger, broader empathy” for beneficiaries only if they felt that was the case.

But again, if the ministers had stuck around, they would have heard the argument that the biggest destroyer of empathy in a society is, in fact, inequality, since people with very different incomes and lives find it hard to empathise with each other.

The ministers did hang around for questions and comments from the audience – and were promptly told that providers of social services in New Zealand were “in crisis” thanks to frozen funding and increased reporting burdens. They were also urged to work in a closer partnership with providers, allowing agencies to help shape strategies, not just deliver them.

However, the ministers showed significant frustration with any talk of partnership. English said the government was “not here to service the NGO [non-governmental organisation] sector”, while Bennett said, “We can come up with some agreed language if that makes you feel better.”

English also made clear his frustration with the public sector, especially over cross-agency collaboration. Joint working on children’s teams, for instance, was being held up by “discussion on whether  the policeman will be told what to do by the nurse. I’m sick of hearing this … [from] well-paid people, with good jobs, getting paid good money.”

If re-elected, English said National would be “reasonably energetic about trying to move these things on. We can’t sit around letting the deliverers get in the way for too long.” In what sounded like a willingness to privatise more services, he said: “The nurse and the policeman will have to sort out their differences … or we will get someone else to do it.”

Catriona Maclennan (barrister, journalist and social activist) has started a series on Face TV about child poverty in New Zealand.

This is a huge part of the inequality story – 285,000 children in poverty (as defined as living in families with less than 60% of the average household income) – and a national embarrassment, frankly.

The first episode is here, and the second episode here. Well worth a look, especially as the election campaign steps up a gear.

More details about the series are available here.


Permalink

The results of the first-ever trial of a Warrant of Fitness for New Zealand houses are in, and they look good.

The trial was run by several local councils, and involved 144 houses around the country being checked for things like having insulation, proper electrical wiring, smoke alarms, no leaks or major mould, proper heating, good plumbing and so on.

The headline result is that of the 144, just eight passed. But the most common failures were from relatively minor (and cheap to fix) problems, such as the water coming out of the hot taps not being hot enough, windows not having those stays that prevent children from opening them and falling out, and so on.

If those minor problems had been fixed, 36% of houses would have passed.

Of the 24 landlords interviewed following the trial, 19 said they had noted ways their houses could be warmer, dryer, or safer as a result of the assessment, and 15 had taken action to improve their property as a result of participating in the trial.

Only a small minority of the private landlords (12%) interviewed stated they would put up the rent as a result of improvements made.

Over three quarters of tenants in the survey supported the idea of a Warrant of Fitness.

So what are the results telling us? They show the clear need for a Warrant of Fitness, since so many houses failed on substantial grounds – even though, and this is an important point, the landlords who participated were probably above average, since they volunteered to take part. Despite much progress on insulation recently, this remains one of the biggest failures of many houses.

Responding to the landlord feedback, the team doing the research has already concluded that some items should be dropped, like the window stays.

One big challenge for making the Warrant of Fitness mandatory will be getting landlords onside. Even in this self-selected group of relatively responsible landlords, only half of them supported a mandatory Warrant of Fitness scheme, with more supporting a voluntary one.

The argument that will probably be made to them is that we don’t allow sub-standard cars to stay on the road without a Warrant of Fitness, no matter the cost and inconvenience to car owners, so why should bad houses be any different?

Either way, the report on the trial concludes: “In general the results are very positive. There is a workforce willing and able to carry out the inspections at a reasonable price and both landlords and tenants appear to generally support a rental housing WOF.

“The challenge will be to establish the appropriate regulatory framework to support the Rental WOF and carry out an implementation trial to evaluate the costs and benefits of a housing WOF.”

Housing Warrant of Fitness Pre-Test

The World Top Incomes Database has just updated its figures for New Zealand’s richest inhabitants.

While the update only takes us up to 2011, the figures are still revealing. In 1986, the average person in the top 1% got around $159,000 (adjusted for inflation); in 2011, they got $337,000 – more than double.

During that same time, incomes for the poorest New Zealanders have increased just 13%. That’s increased inequality in a nutshell.

It’s true that $337,000 isn’t really any higher than the average 1%er earned in the early 2000s, or the late 1990s for that matter. So you could argue that we’re in a holding pattern. But I still think a trend of rising inequality, post-GFC, is starting to take shape.

Between 2008 and 2010, in the wake of the GFC, the average 1%er income fell from about $340,000 to $300,000. So there was quite a bounce back up to that 2011 figure.

That rise could be temporary, but I suspect it’s not. The general pattern of crises is that the richest people take a temporary hit, and then recover quicker than anyone else. That’s been the pattern in countries which have data beyond 2011, such as the US and the UK.

New Zealand could be different, but the anecdotal evidence I see – the NBR Rich List, and news stories about conspicuous consumption in Auckland – make me think we’re just the same.

Only time will tell, but my hunch is that this is another sign of rising inequality once again.

And it’s worth remembering that these figures, which are based on IRD tax returns, don’t include capital gains (not taxed, let alone recorded). A rising stockmarket and soaring housing market will have seen those gains increase sharply – mostly to the benefit of the 1% – and so these figures will understate the true increase in inequality.

One final thought. In 1998, just before Labour’s 39% tax rate hit, the 1% declared a staggering $500,000 each in income, which shows just how much they can shift their money around to avoid tax. It’s a further reason to think that all these figures are only grasping at the shadows of true wealth in New Zealand.

Permalink

When I raise the point that New Zealand has become much more unequal since the 1980s – faster than almost any other country – one of the common responses is: yes, but we’ve made so much social progress since then. Outcomes for traditionally disadvantaged groups have improved as we’ve become a more tolerant and modern nation. Are you arguing that we should go back to the days when – say – women and Maori had far lower status than they do now?

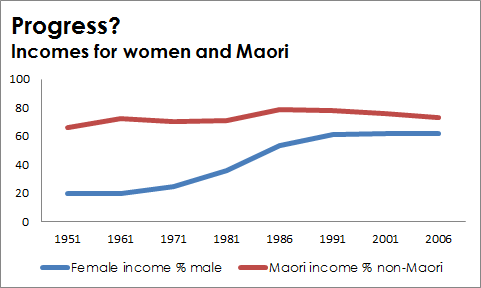
It’s a reasonable point, but the data don’t really bear it out. Consider the graph below, which shows what has happened to income for women, as a percentage of men’s income, and income for Maori, as a percentage of non-Maori income, since 1951.

What you see immediately is that although incomes for both groups were improving (albeit slowly for Maori) from the 50s through to the 80s, that progress has now stopped, or even gone into reverse slightly. Both groups were catching up with Pakeha men until the mid-1980s; since then, they have made no gains.

Maori and women incomes 1951-2006

This is not to deny the progress in the cultural and political fields, where – for instance – recognition of Maori culture is far greater than it was. But when it comes to incomes, at least, those gains have been outweighed by brute economic and political factors: the wrenching structural adjustments in the 1980s that saw Maori unemployment soaring, for instance, and the increasingly punitive approach to low-income families, which often hits hardest on women.

Economically, at least, the current system isn’t delivering for women and Maori, any more than it is delivering a fair share of incomes among the wider population.


Disasters often reinforce inequality: those with higher income recover faster than those who had few resources to tide them through the crisis.

So when one cares about inequality, as I do, what goes on in somewhere like Christchurch matters deeply. One way that inequality manifests there is in housing. The worst affected are those reliant on rented housing, in a market where rents have increased a staggering 44% since the earthquake. (That’s unadulterated supply and demand for you.)

In 2011, as you would expect, rents in Christchurch weren’t that high: around $300 a week was the average rent, as opposed to $400 a week in Auckland.

But according to Cera predictions in the document below, in just eight months’ time, in January 2015, rents in Christchurch will have hit the same level as in Auckland: around $460 a week on average.

If that happens, it will be a further blow to those already trying to patch life together in the most difficult of circumstances.

CERA Housing update

Today’s Morning Report interviewed Oliver Williams from something called Wealth Insight, a consultancy, arguing that the world’s first trillionaire would be created within 50 years.

Predictably, Williams tried to claim that to get that rich “you would have to invent something or create something”. But as Thomas Piketty’s new book Capital in the Twenty-First Century points out, most wealth is actually inherited. In the 19th century, 90% of all wealth was inherited; that figure fell to below 50% in 1970, but is now back up to 70% and rising.

Williams pointed to the example of Bill Gates to back up his argument, but in fact, as Piketty again shows, the wealthy are just as likely to be someone like Lilianne Bettencourt, the heir to the L’Oreal fortune, whose wealth has increased just as fast as Gates’s in the last few decades despite her not ever having worked for it.

Whenever the world does get a trillionaire, in other words, they are likely to have inherited the vast majority of that money. A fact that isn’t convenient if you want to argue that the wealthy deserve every cent they have, but which is nonetheless true.

The OECD’s latest research – which warns about concentrating power and privilege at the top, and advocates new tax measures – is yet another sign that even major international institutions have woken up to the danger of inequality.

The Focus on Top Incomes shows New Zealand isn’t immune from the 1%er phenomenon. Over the last 30 years, our top 1% has got one dollar in every six (14%) of all the income generated in that time. While that’s nowhere near as bad as in the US, where that figure is an almost unbelievable 47%, we’ve done much worse than, say, Denmark, where the top 1% got just 2.5% of income growth since 1981.

“The disproportionate surge in top incomes … helps explain why so many people have not felt their incomes rising in line with national GDP growth,” the OECD says. “This explains why the majority of the population cannot reconcile the aggregate income growth figures with the performance of their incomes.”

This will be precisely the left’s narrative for the election campaign: the economy may be recovering, but are you seeing your share of it?

This phenomenon also makes a big difference to those comparisons of growth rates you often see. The United States may have fantastic overall GDP growth – but most of it goes to the rich, and if you look at growth rates for ordinary people, they’re actually much higher in many other countries.

What’s also fascinating is that the OECD rejects the explanations often given for the 1%’s income gains. In particular, it has little time for the idea that the 1% are earning more because they are now global superstars. That can’t be true, it points out, because incomes aren’t soaring right across the globe.

In another break from orthodoxy, the OECD says we need to think very hard about tax rates at the top. Governments have “several options at hand to increase effective taxation paid by top income recipients”.

For reasons that aren’t clear, the OECD doesn’t like the idea of just increasing the top tax rate. But it does recommend a whole lot of other ideas, including:

•  Abolishing or scaling back tax deductions, credits and exemptions (more relevant to America than New Zealand)

• Taxing as ordinary income all remuneration, including fringe benefits, carried interest  arrangements and stock options;

• More taxes on immovable property, i.e. wealth

• Reviewing other forms of wealth taxes such as inheritance taxes

• Increasing transparency and international cooperation on tax rules to minimise “treaty shopping”

• Developing policies to improve transparency and tax compliance

Throughout the document you can feel the influence of Thomas Piketty, whose bestselling book Capital in the Twenty-First Century hones in on the 1%, and warns of the danger of allowing the buildup of great wealth. Echoing his book’s message very closely, the OECD concludes: “Decreasing marginal tax rates for top incomes and tax exemptions for capital income may result in top income groups accumulating more capital and wealth and transmitting this through bequests to younger generations, continually concentrating power and privilege.”

It’s yet another sign of change. A generation ago, you wouldn’t have heard the OECD warning about “concentrating power and privilege”, or finding new ways to tax the rich. But that’s how far the debate has come.