This document summarises the key points on inequality and poverty from the 2015 Household Incomes Report, published by the Ministry for Social Development.
Inequality
On most measures, income inequality is either at the highest level it has been since records began in 1982, or is very close to that level. It has also risen sharply in both the last two years.
The government generally claim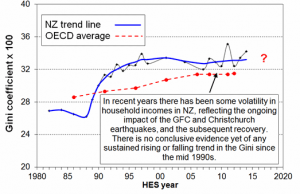 s that inequality is not increasing. The Household Incomes Report, which is quite rightly cautious, continues to say there is no “conclusive” evidence of rising inequality. But as the graph (at left) of the Gini coefficient shows (in which 0 is perfect equality and 100 is perfect inequality), it is starting to look like an upward trend, and the Report says that one more year of data at this level will be enough for it to conclude that inequality is indeed rising.
One way to look at what has happened with income inequality recently is to consider the contrasting fortunes of different groups, as in the table below.
| Group | Av. income 2009 ($) | Av. Income 2014 ($) | Change ($) | Change % |
| Poorest tenth | 12600 | No information | – | – |
| 2nd tenth | 18800 | 19000 | 200 | 1.1% |
| 3rd tenth | 23000 | 23200 | 200 | 0.9% |
| 4th tenth | 27000 | 27700 | 700 | 2.5% |
| 5th tenth | 31100 | 32400 | 1300 | 4.0% |
| 6th tenth | 35600 | 38400 | 2800 | 7.3% |
| 7th tenth | 41000 | 44500 | 3500 | 7.9% |
| 8th tenth | 47700 | 52800 | 5100 | 9.7% |
| 9th tenth | 58700 | 64400 | 5700 | 8.9% |
| Richest tenth | 102500 | 108400 | 5900 | 5.4% |
As can be seen, since the crisis (and the beginning of the current government’s term in office), those in the poorest groups have seen average income increases of just $200, while the increases have been of the order of $5,000-6,000 at the richest end. (There was no information for the poorest 10th in 2014 because of problems with the way that benefits income was recorded.)
Poverty
Total poverty has been relatively steady since the global financial crisis, under the measures that look at how many households (HH) have less than 50% or less than 60% of the typical household’s income (adjusted for household size). However, poverty is far higher than in the 1980s.
Year HH under 50% HH under 60%
1986 6% 13%
2009 10% 19%
2014 10% 20%
On the under 60% figure, and assuming a population of 4.42 million, there are approximately 880,000 New Zealanders in poverty.
When housing costs are taken into account, the above trends and figures are roughly the same, with the difference that the under 50% rate has gone from 13% in 2009 to 15% in 2014, indicating that housing costs make the biggest difference among the very poorest, and are increasing. After housing cost poverty is roughly double its 1980s level, again pointing to housing’s growing role.
Child poverty
There are many different measures for child poverty, as the table below shows. However, the overall trend is for an increase in child poverty of somewhere between 10,000 and 45,000 children since 2009. The exception is the ‘anchored line’, which looks at how many children are under the 2007 poverty line (as opposed to how many are under today’s poverty lines). But even here, where one would expect poverty to decline consistently as the economy grows, the figures look static.
| Before housing costs | After housing costs | |||||
| BHC ‘moving line’ | AHC ‘moving line’ | AHC ‘anchored line (2007)’ | ||||
| HES year | 50% | 60% | 40% | 50% | 60% | 60% (07 ref) |
| 2001 | 120,000 | 250,000 | 115,000 | 215,000 | 310,000 | 380,000 |
| 2004 | 150,000 | 265,000 | 115,000 | 200,000 | 285,000 | 320,000 |
| 2007 | 135,000 | 210,000 | 115,000 | 175,000 | 240,000 | 240,000 |
| 2009 | 125,000 | 230,000 | 140,000 | 210,000 | 280,000 | 255,000 |
| 2010 | 150,000 | 250,000 | 120,000 | 210,000 | 315,000 | 275,000 |
| 2011 | 145,000 | 235,000 | 130,000 | 210,000 | 290,000 | 270,000 |
| 2012 | 130,000 | 225,000 | 135,000 | 215,000 | 285,000 | 255,000 |
| 2013 | 120,000 | 215,000 | 135,000 | 205,000 | 260,000 | 235,000 |
| 2014 | 150,000 | 250,000 | – | 220,000 | 305,000 | 245,000 |
Reference: Household incomes in New Zealand: Trends in indicators of inequality and hardship, 1982 to 2014, MSD